How to Find High Demand Low Competition Products on Amazon
The most popular advice on Amazon product research is also the easiest way to waste time: find a niche with almost no competition. A quiet search page can mean an overlooked opportunity, but it can just as easily mean buyers aren't purchasing. I treat low competition as a warning until demand, unit economics, and legal checks all support the same decision.
A workable niche doesn't need an empty results page. It needs buyers who already choose among several products, with enough room for a new offer to earn attention without relying on one keyword spike or an implausibly cheap price.
Table of Contents
- What High Demand and Low Competition Mean on Amazon
- How to Shortlist Niches in Seven Steps
- Competition Metrics to Record for Each Candidate
- Telling Durable Demand From a Short Spike
- Checking Fees, Margins and Trademark Risk
- Deciding Whether to Launch a Niche
What High Demand and Low Competition Mean on Amazon
Low competition doesn't mean zero sales. If no listings appear to be selling, you haven't found proof of an opening. You've found a question to investigate: is demand unmet, or is there little purchase intent?
Amazon's 2024 Consumer Search Trends Report recorded monthly search volumes ranging from 10.63 billion searches in July to 20.93 billion in December. That swing is a reminder to account for seasonality from the start, rather than judging a phrase by a single month. The report also found that the top 20 products didn't dominate traffic, suggesting that shopper attention was distributed across listings rather than captured by a handful of winners.
For this article, high demand means repeated buyer interest across multiple products in a specific niche, not just a large number beside one broad keyword. Low competition means the leading listings don't fully control buyer attention. You're looking for a market where several products show evidence of sales, but customer needs, designs, or search phrases still leave room for a differentiated offer.
That distinction matters for print-on-demand (POD). A broad phrase such as “fishing gift” may be crowded and vague, while a more specific audience, occasion, or style can give you a clearer angle. Search for growing subtopics with existing buyers, then test whether the best listings leave an unmet need. Each signal is evidence, not a verdict.
How to Shortlist Niches in Seven Steps
Amazon's product research guidance recommends starting with a funnel rather than a favorite idea, and the purchase-signal logic behind that advice is easy to see in a hypothetical pair of phrases. Say a broad term draws 100,000 searches but only 500 purchases, while a narrower phrase draws 10,000 searches and 3,000 purchases. The second phrase reaches fewer shoppers. It also carries far stronger evidence that those shoppers buy, which is the signal worth shortlisting.
Collect seed phrases. Gather 30 to 50 search suggestions, related searches, and bestseller-title phrases within one category. Keep the list focused enough that the products and buyers are comparable.
Narrow each phrase by angle. Add an audience, occasion, or style. "Fishing gift" becomes "fishing gift for grandpa birthday," which gives you a clearer buyer and use case to assess.
Check demand over time. Use a keyword tool or Amazon Product Opportunity Explorer to inspect the 12-month trend for each phrase. A rising line is a lead; it still needs purchase evidence behind it.
Compare purchase signals, not volume alone. Look for estimated keyword sales, click-through behavior, and product-level sales alongside search activity. Keep phrases where actual purchase interest appears to extend beyond one unusually popular listing.
Record the top 10 listings. Note prices, review counts, ratings, brand concentration, and stockout frequency. This snapshot shows whether the niche has real buyers and whether several sellers can reach them.
Label the evidence. Mark each phrase as demand-strong, competition-open, or both. Treat low competition as a warning sign until the other signals clear it, because thin listings can mean buyers are not there.
Score a short list. Keep three to five candidates and give each a score from 1 to 5 for demand, competition, margin, and legal risk. I treat margin and legal scores as provisional until the fee and rights checks later in this guide are done.
| Criterion | Score 5 looks like | Score 1 looks like | Where to check |
|---|---|---|---|
| Demand | Steady 12-month trend, with several sellers taking sales | Single spike or no purchase signal | Keyword tool or Product Opportunity Explorer |
| Competition | Several sellers show sales; no single brand dominates | One brand holds most top spots, or many new listings show no sales | Top 10 listings and newest-sorted results |
| Margin | Positive contribution margin using an assumed 15% fee, 5% refund allowance, and higher ad cost | Negative margin under realistic ad costs | Per-unit margin calculation |
| Legal risk | Exact phrase passes an initial USPTO search and Merch on Demand content screening | Phrase matches a live registration or prohibited content | USPTO trademark database and Merch on Demand terms |
Put each candidate on its own row in a simple sheet and sort by total score. A strong competition score only counts when demand, margin, and legal agree with it; a niche that scores 5 on openness and 1 on demand belongs at the bottom of the sheet. For another practical take on how to evaluate demand and competition on Amazon, compare that scoring approach with your top-10 notes. If you are building the keyword list from scratch, this walkthrough on Amazon keyword research can help you organize candidate phrases before you validate them.
Competition Metrics to Record for Each Candidate
| Metric | Where to check | Healthy sign | Warning sign |
|---|---|---|---|
| Top 10 price band | Search results page | Most prices cluster within a few dollars | Prices spread widely with no clear anchor |
| Review count of top 10 | Listing pages | Some sellers with fewer than 200 reviews still sell | Every top listing has more than 2,000 reviews |
| Average rating and complaints | Listing and review pages | Ratings around 4.0 to 4.5, with recurring fixable complaints | Consistently high ratings and no clear, repeated customer problem |
| Brand concentration | Top 10 seller names | Three or more sellers show visible sales | One brand holds most top spots |
| Rank trend | Rank history over 12 months | Rank moves within a steady range | One spike followed by a long decline |
| New listings in last 90 days | Search results sorted by newest | A few new sellers are earning reviews | Many near-identical listings have no sales |
The first question is whether the top listings leave room for another seller. Several sellers with visible sales and a reasonably clustered price band suggest that buyers aren't choosing a single winner exclusively. A page crowded with near-identical designs, or dominated by one brand, is harder to enter even if the headline demand looks attractive.
The second question is whether the review pattern reveals a way to improve the offer. Ratings alone won't tell you what buyers want changed. Read the negative reviews and group complaints by theme: a recurring sizing issue, unclear personalization, or a design that doesn't match the product photos could be more useful than a small difference in average stars.
Treat rank as directional evidence, not a sales calculator. Amazon explains that Best Sellers Rank reflects an ASIN's all-time sales, with recent sales weighted more heavily, and that a product's rank can move even if its own sales stay steady because competitors' sales change. Compare rank within the same category and over time; a single snapshot can't tell you exact unit sales. Amazon also says the Best Seller badge goes to the top-ranked ASIN in a featured category with at least 100 products, so a strong position in a narrow category still doesn't prove a specific sales volume. See Amazon's explanation of Best Sellers Rank for its limits.
Check listings on several days rather than assuming today's results are typical. For a repeatable way to compare the offers, use this competitor benchmarking checklist alongside your spreadsheet.
Telling Durable Demand From a Short Spike
A fixed minimum for monthly searches or estimated sales can misclassify a niche. Categories differ, and a seasonal phrase or one dominant seller can make a single number look more meaningful than it is. Product research guidance on niche durability recommends looking at longer-term rank and price patterns, seller concentration, and recurring customer complaints rather than trusting one snapshot or a universal cutoff.
I'd use four checks:
Compare the current movement with a longer baseline. Look at 12 months of rank and price history to distinguish a sustained pattern from a sudden jump. Keep seasonal peaks in context instead of treating them as the new normal.
Check Buy Box control. If Amazon or one dominant seller controls the Buy Box, the visible demand may be hard for a new offer to capture. A busy page doesn't guarantee that your product will get comparable exposure.
Count independent sellers across related phrases. Look for several sellers with signs of sales across the niche, not one outlier attached to a viral phrase. Related queries can reveal whether buyers are searching for a broader need or only a momentary trend.
Read one- and two-star reviews. Note complaints that repeat across listings and ask whether your product can solve them. A single complaint may be personal preference; the same problem recurring across several listings is a stronger lead.
For POD, a holiday phrase can spike for ten days and cool before a design is approved, indexed, and ready to fulfill. That search activity might justify a quick watchlist, but not a decision to build the next month's work around it.
Moderate demand can be more useful than the biggest keyword when buyers keep searching and current products leave a visible satisfaction gap. I'd rather see durable interest spread across sellers than chase the phrase with the highest volume and the shortest shelf life.
Checking Fees, Margins and Trademark Risk
Amazon's referral fee is calculated using the total sales price, including item price and any delivery or gift-wrap charges, multiplied by the category rate. If the applicable minimum fee is higher, that minimum applies instead, and Amazon charges the referral fee when the order ships. Check the category and minimum before treating a low retail price as profitable. Amazon sets out the mechanics on its seller pricing page.
The table is a hypothetical POD example, not an Amazon fee quote. It assumes a $20.00 item price, a 15% referral fee on item price only, $6.50 production and shipping, and a 5% refund allowance. Ad cost per sale is $3.00 in the base case and $5.00 in the higher-cost case. The lower-price case uses a $13.33 price, which keeps the assumed 15% fee near $2.00 and the refund allowance near $1.00. The final margin subtracts production and shipping, referral fee, refund allowance, and advertising.
| Scenario | Production and shipping | Refunds at 5% | Margin per unit |
|---|---|---|---|
| Base case at $20.00, $3.00 ad cost | $6.50 | $1.00 | $6.50 |
| Higher ad cost at $20.00, $5.00 ad cost | $6.50 | $1.00 | $4.50 |
| Lower price at $13.33, $3.00 ad cost | $6.50 | $1.00 | $0.83 |
The lower-price version still shows a positive margin in this simplified model, but it has little room for other costs. Replace the assumptions with your actual category rate, minimum fee, production cost, fulfillment fees, advertising, and refund experience. Then lower your price and raise advertising cost in the spreadsheet. If contribution margin turns negative, don't let a strong search trend talk you into the launch. For a more complete landed-cost breakdown, calculate landed costs with Supply Automate and adapt the calculation to your own fulfillment setup.
Before publishing a POD design, search the exact phrase in the USPTO trademark database, then inspect similar wording and spellings, live applications or registrations, goods descriptions, owners, and status. A matching phrase isn't automatically a legal conclusion, but an active mark covering apparel or closely related goods deserves careful review. USPTO database searching is one part of clearance, not a guarantee that a design is safe.
Amazon Merch on Demand also requires content to comply with its policies and applicable laws, including intellectual-property rules. Trendy wording doesn't give you permission to use protected branding, another person's artwork, or unauthorized imagery. Trendlytic can speed up a preliminary USPTO check for POD keywords, but it doesn't replace a fuller rights review. If your offer has meaningful variations, think through whether a bundle strategy can improve value without adding costs that erase the margin.
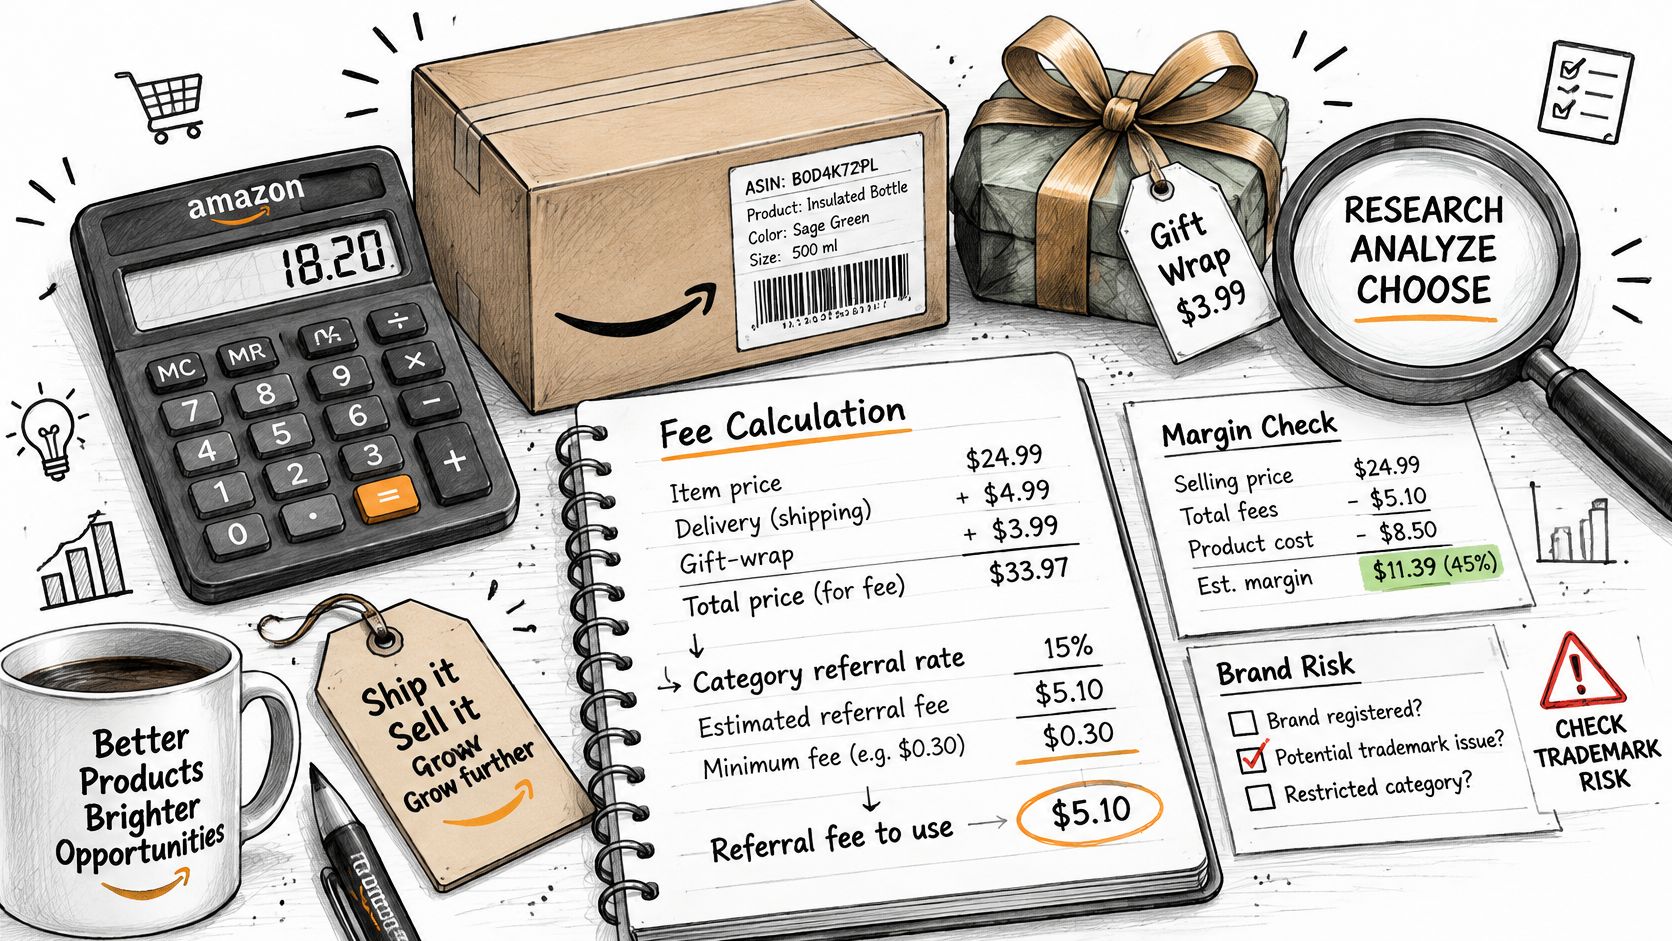
A fee model only helps if the assumptions match the listing you plan to sell. Use this Amazon seller planning walkthrough as an additional reference, then verify the current fee inputs against your category and fulfillment method.
Deciding Whether to Launch a Niche
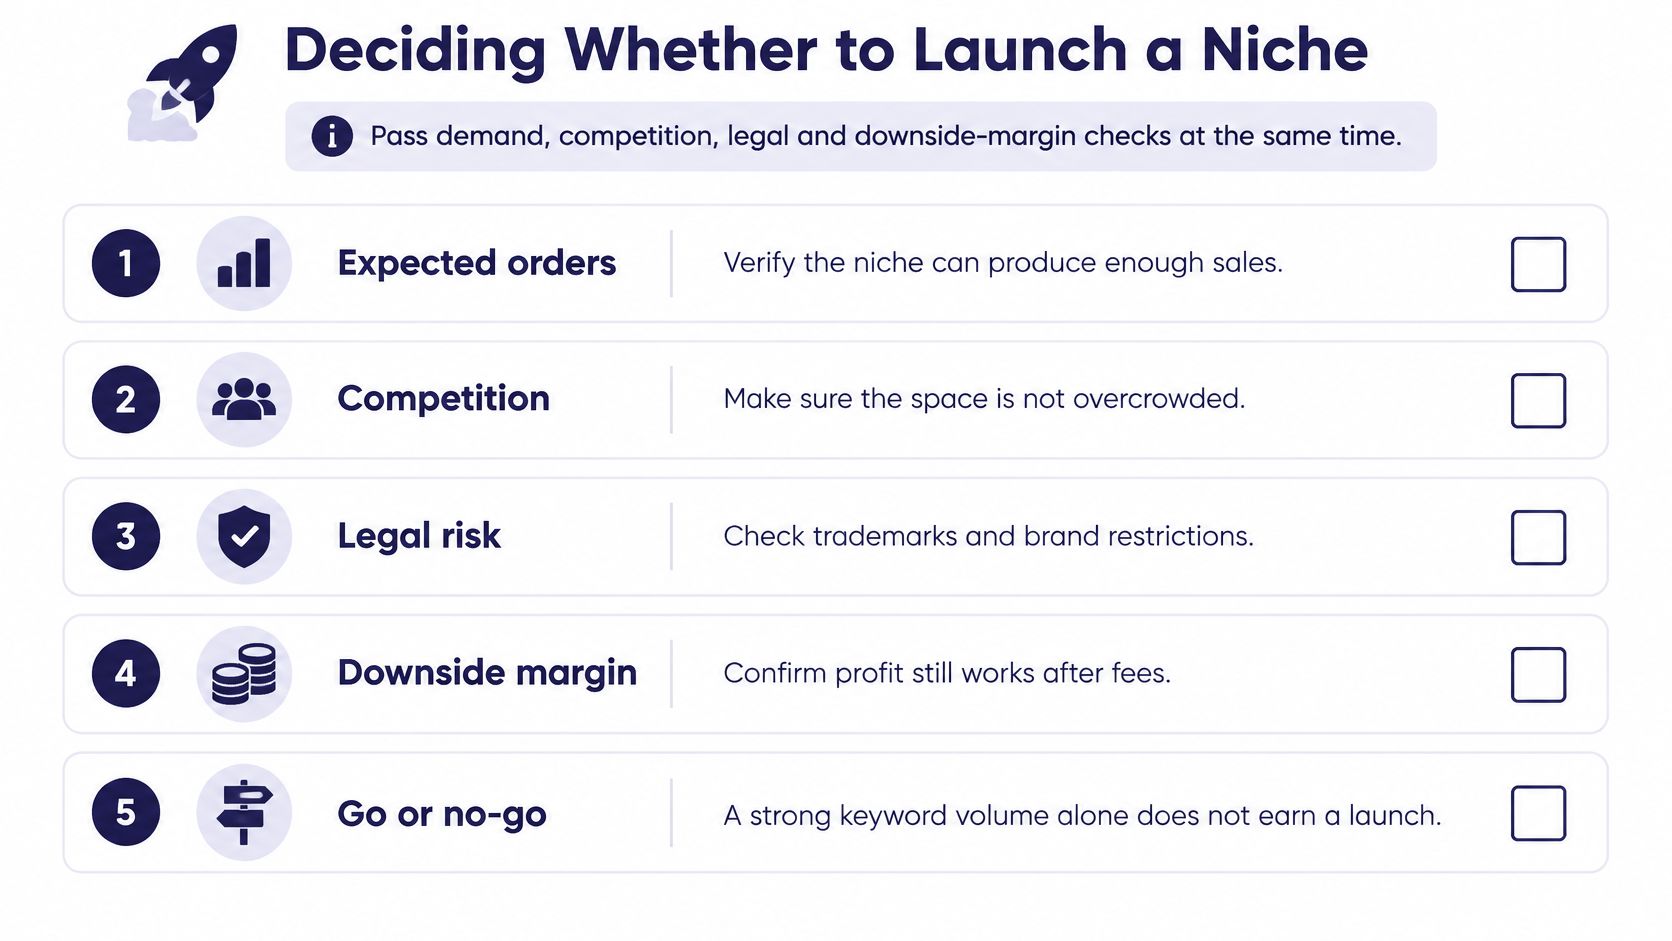
A good keyword doesn't earn a launch on its own. The niche needs to pass demand, competition, legal, and downside-margin checks together. Estimate expected orders as qualified sessions multiplied by a category-adjusted conversion rate, then compare like with like: products in similar categories, at similar prices, with listings at a similar level of maturity.
Conversion benchmarks are screening assumptions, not promises. A guide to Amazon conversion rates gives commonly reported ranges of around 5–10% overall, approximately 8–12% for apparel, and 6–10% for electronics. Use the lower end when you stress-test a candidate, especially if your listing is new or the product price differs from the competitors you're comparing.
Make a clear go, wait, or drop decision
Go when the demand is durable, the listings leave room to compete, the legal checks are recorded, and margin remains positive at the low end of your expected conversion range, even with higher ad costs.
Wait when buyer interest looks promising but a trademark, content, or eligibility question is unresolved. Resolve that uncertainty before you make the design or listing commitment.
Drop when realistic ad costs make the margin negative, or the opportunity rests on a single spike. A quiet search page isn't a reason to lower your standards.
Before launch, check that every criterion on your scoring sheet is at least 4 out of 5, expected orders still work at the low end of your conversion assumption, and the trademark and content screens are complete and recorded. Confirm that two or three leading listings show a recurring complaint your offer can address, then rerun the margin model with a higher ad cost.
If you use a niche tool such as Trendlytic to build your first shortlist, verify each finding on the live marketplace before committing budget. Tool data is a starting point, not a guarantee.
Trendlytic researches POD niches across TeePublic, Amazon Merch, Redbubble, and Etsy, and includes a preliminary USPTO trademark check. Use Trendlytic to organize a shortlist of demand and competition signals, then confirm the strongest candidates against live listings, legal checks, and your own margin model.